| 【精选】Prometheus+Node | 您所在的位置:网站首页 › grafana agent 采集SNMP › 【精选】Prometheus+Node |
【精选】Prometheus+Node
|
Prometheus+Node_exporter+Grafana监控(附送保姆级别linux安装攻略)
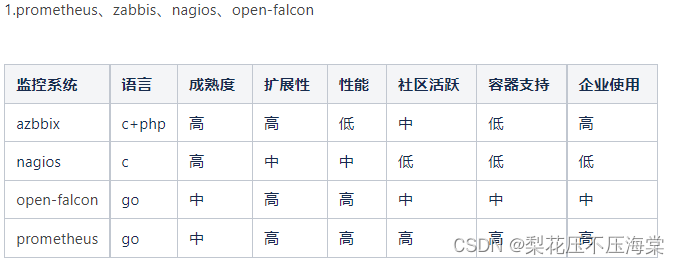
前言:监控系统技术选型
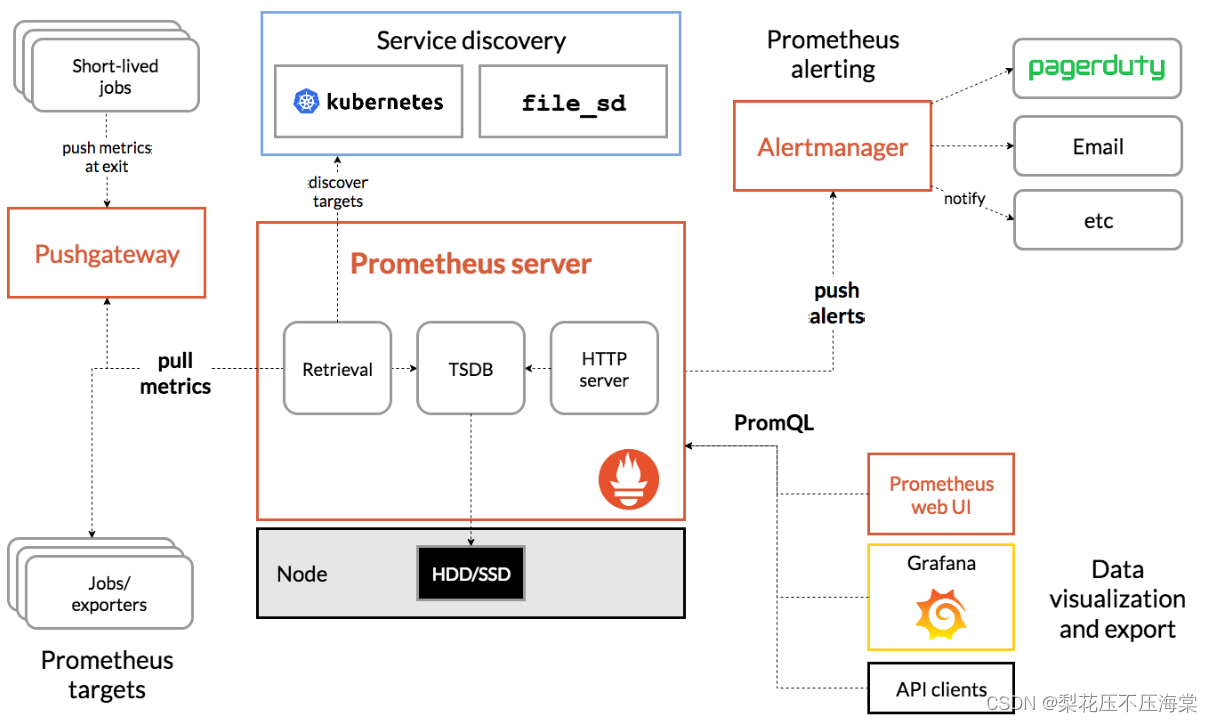
选型结果: prometheus+node_exporter+grafana Prometheus架构图
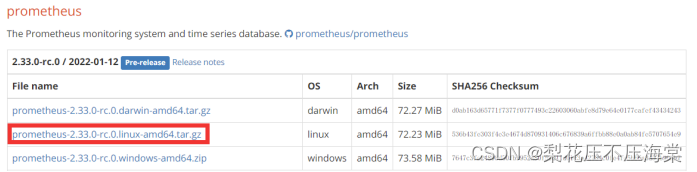
1.1、Prometheus 1、在官⽹下载Prometheus:https://prometheus.io/download/ 2、选择 prometheus-2.33.0-rc.0.linux-amd64.tar.gz 下载 [root@prometheus opt]# tar -zxvf prometheus-2.33.0-rc.0.linux-amd64.tar.gz 5.修改包名 root@prometheus opt]# mv prometheus-2.33.0-rc.0.linux-amd64 prometheus/6.进⼊prometheus⽬录,验证安装版本 [root@prometheus prometheus]# cd /opt/prometheus [root@prometheus prometheus]# ./prometheus --version7.prometheus.yml初始配置项说明 # my global config # prometheus的全局配置 global: # 指定抓取数据的时间间隔 scrape_interval: 15s # Set the scrape interval to every 15 seconds. Default is every 1 minute. # 指定prometheus重新评估⼀次规则的时间间隔 evaluation_interval: 15s # Evaluate rules every 15 seconds. The default is every 1 minute. # scrape_timeout is set to the global default (10s). # Alertmanager configuration # 警报管理器Alertmanager的配置项 alerting: alertmanagers: - static_configs: - targets: # - alertmanager:9093 # 指定记录规则和警报规则的⻆⾊列表 # Load rules once and periodically evaluate them according to the global 'evaluation_interval'. rule_files: # - "first_rules.yml" # - "second_rules.yml" # 指定prometheus抓取的端点数据 # 抓取指标的数据源叫做:端点 # A scrape configuration containing exactly one endpoint to scrape: # Here it's Prometheus itself. scrape_configs: # 从本机的9090端⼝抓取数据并追加到 http://localhost:9090/metrics # 指定抓取prometheus机器本身的作业数据 # The job name is added as a label `job=` to any timeseries scraped from this config. - job_name: "prometheus" # metrics_path defaults to '/metrics' # scheme defaults to 'http'. static_configs: - targets: ["localhost:9090"]8.启动Prometheus root@prometheus ~]# cd /opt/prometheus nohup ./prometheus --config.file=prometheus.yml &查看nohup记录 10.浏览器输⼊可视化界⾯地址 http://服务器IP:9090/graph
1、在官⽹下载Grafana:https://grafana.com/grafana/download 2、也可以在Linux虚拟机中输⼊命令下载和安装 get https://dl.grafana.com/enterprise/release/grafana-enterprise8.3.4.linux-amd64.tar.gz [root@prometheus opt]# tar -zxvf grafana-enterprise-8.3.4.linuxamd64.tar.gz [root@prometheus opt]# mv grafana-8.3.4/ grafana/3、启动Grafana [root@prometheus grafana]# cd /opt/grafana [root@prometheus grafana]# nohup bin/grafana-server start &4.浏览器输⼊Grafana地址,验证启动结果 初始账号密码:admin / admin http://服务器IP:3000/login
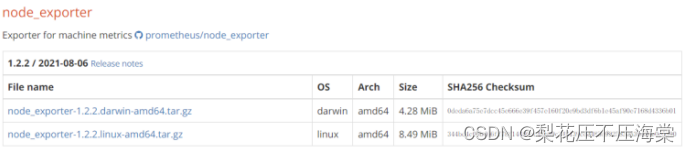
exporters⽬前总体上分为两种:⼀种是Prometheus官⽅在GitHub上维护的,另⼀种的其他的第三⽅开 发提供给⼤众使⽤的,不同的exporter可以采集不同的数据信息。 采集Linux系统主机参数和硬件指标的exporter叫做Node exporter,是⼀款⽤Go编写,可收集包括 CPU、内存、磁盘等数据信息的主机指标采集库。 注:需要采集哪台主机的指标数据,就部署在哪台机器上,⽬前在订单项⽬的11个系统上都部署了 1、本次先把Node exporter搭建在Prometheus主机上,实现监控 Prometheus主机指标监控 2、在官⽹下载Node exporter:https://prometheus.io/download/ 3、选择 node_exporter-1.2.2.linux-amd64.tar.gz 下载
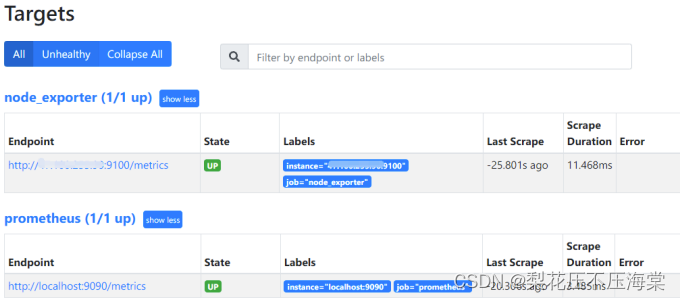
7.启动Node exporter [root@prometheus node_exporter]# nohup ./node_exporter &8.修改prometheus.yml 新增Job名称叫做"node_exporter"的作业来抓取Node exporter导出的指标数据 targets配置的是当前⽬标主机的IP和Node exporter运⾏端⼝,书写配置⽂件时注意格式 # my global config # prometheus的全局配置 global: # 指定抓取数据的时间间隔 scrape_interval: 15s # Set the scrape interval to every 15 seconds. Default is every 1 minute. # 指定prometheus重新评估⼀次规则的时间间隔 evaluation_interval: 15s # Evaluate rules every 15 seconds. The default is every 1 minute. # scrape_timeout is set to the global default (10s). # Alertmanager configuration # 警报管理器Alertmanager的配置项 alerting: alertmanagers: - static_configs: - targets: # - alertmanager:9093 # 指定记录规则和警报规则的⻆⾊列表 # Load rules once and periodically evaluate them according to the global 'evaluation_interval'. rule_files: # - "first_rules.yml" # - "second_rules.yml" # 指定prometheus抓取的端点数据 # 抓取指标的数据源叫做:端点 # A scrape configuration containing exactly one endpoint to scrape: # Here it's Prometheus itself. scrape_configs: # 从本机的9090端⼝抓取数据并追加到 http://localhost:9090/metrics # 指定抓取prometheus机器本身的作业数据 # The job name is added as a label `job=` to any timeseries scraped from this config. - job_name: "prometheus" # metrics_path defaults to '/metrics' # scheme defaults to 'http'. static_configs: - targets: ["localhost:9090"] # Node exporter - job_name: "node_exporter" static_configs: - targets: ["xxx.xxx.xxx.xxx:9100","xxx.xxx.xxx.xxx:9100","xxx.xxx.xxx.xxx:9100"]9.重启Prometheus 在浏览器的Targets标签中能看到新加⼊的node_exporter作业 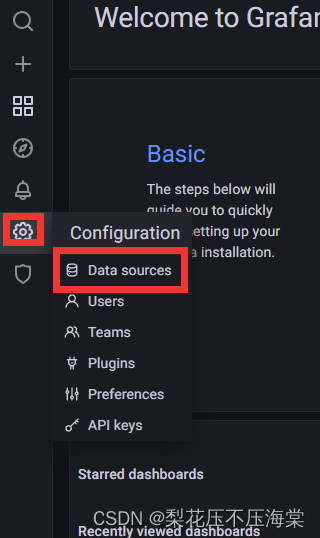  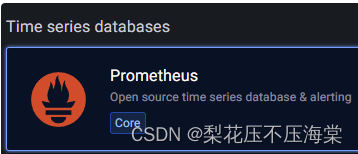 输⼊数据源名称,可以使⽤默认的名称:Prometheus,也可以设置Prometheus是默认数据源 输⼊数据源名称,可以使⽤默认的名称:Prometheus,也可以设置Prometheus是默认数据源 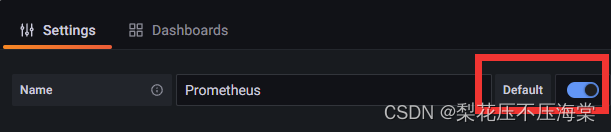 在HTTP URL选项输⼊Prometheus主机的数据源地址 在HTTP URL选项输⼊Prometheus主机的数据源地址 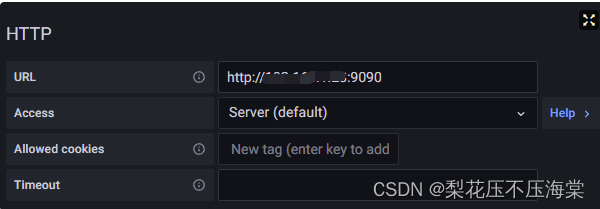 输⼊后直接点击保存,因为稍后会进⾏可视化⾯板的安装,所以在这⾥不配置图形界⾯ 输⼊后直接点击保存,因为稍后会进⾏可视化⾯板的安装,所以在这⾥不配置图形界⾯ 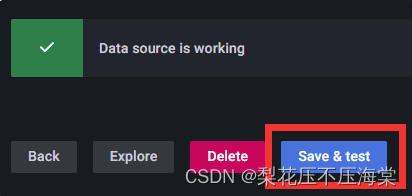 Grafana官⽹提供各种监控数据的可视化数据⼤盘模板,开箱即⽤ 数据⼤盘官⽅下载地址:https://grafana.com/grafana/dashboards/ Grafana官⽹提供各种监控数据的可视化数据⼤盘模板,开箱即⽤ 数据⼤盘官⽅下载地址:https://grafana.com/grafana/dashboards/  这⾥记住12884,回到Grafana界⾯,在左侧导航栏选择 Import 选项 这⾥记住12884,回到Grafana界⾯,在左侧导航栏选择 Import 选项 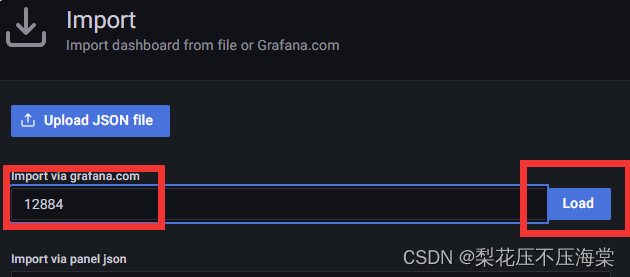 在弹出的界⾯中选择Prometheus作为数据源,然后选择Import 在弹出的界⾯中选择Prometheus作为数据源,然后选择Import 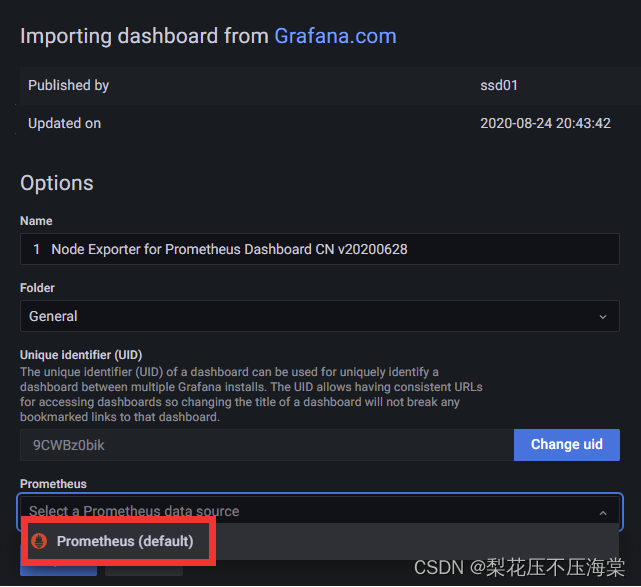
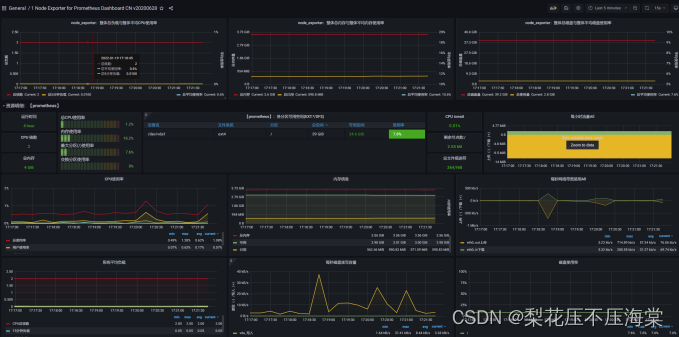
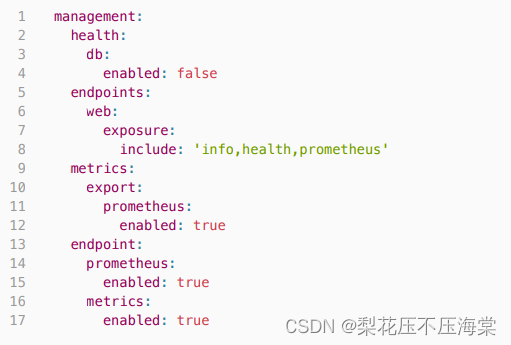
弹出可视化⼤盘,这时可以看到主机指标监控数据 2.1再业务系统中加入jvm监控埋点 1、增加pom.xml io.github.mweirauch micrometer-jvm-extras 0.2.22、监控依赖 org.springframework.boot spring-boot-actuator org.springframework.boot spring-boot-actuator-autoconfigure io.micrometer micrometer-registry-prometheus io.github.mweirauch micrometer-jvm-extras3、增加application.yml配置
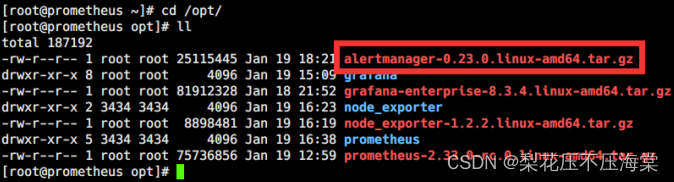
5、修改prometheus.yml配置⽂件,增加监控job # JVM - job_name: "jvm" metrics_path: '/actuator/prometheus' static_configs: - targets: ["xxx.xxx.xxx.xxx:8005"]6、进⼊Prometheus Grafana界⾯,点击左侧导航栏中的Import 1、下载alertmanager-0.23.0.linux-amd64.tar.gz,将安装包上传到被监控 的指定⽬标服务器,(需要哪台机器发送告警就部署到哪台机器上) 3、接收告警邮箱以QQ邮箱为例,确保开通POP3和IMAP邮箱服务
alertmanager.yml配置 6、检查配置⽂件正确性 [root@prometheus ~]# cd /opt/alertmanager [root@prometheus alertmanager]# ./amtool check-config alertmanager.yml7、启动alertmanager [root@prometheus alertmanager]# nohup ./alertmanager &8、建⽴告警规则 建⽴⽤于测试监控告警的规则:内存使⽤率⼤于 1% 1、进⼊prometheus⽬录 [root@prometheus ~]# cd /opt/prometheus2、建⽴mem_rule.yml告警规则 在 prometheus ⽬录(/opt/prometheus/prometheus)建⽴告警规则⽂件
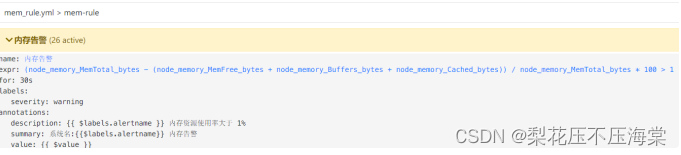
10、验证告警 重启prometheus服务后,稍等⽚刻,会发现内存使⽤率⼤于1% |
 3、上传 prometheus-2.33.0-rc.0.linu
 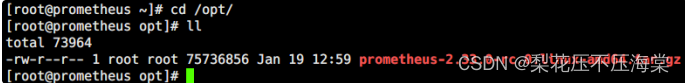 4.解压安装包
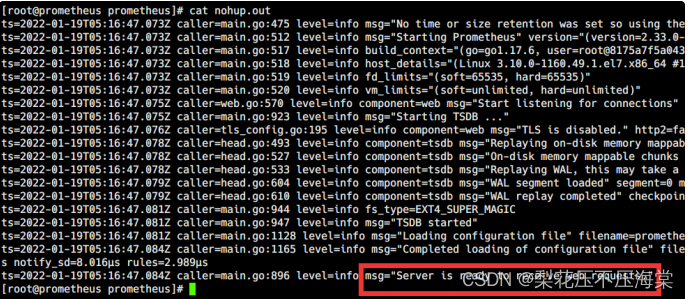 9.浏览器输⼊采集数据地址,验证启动结果
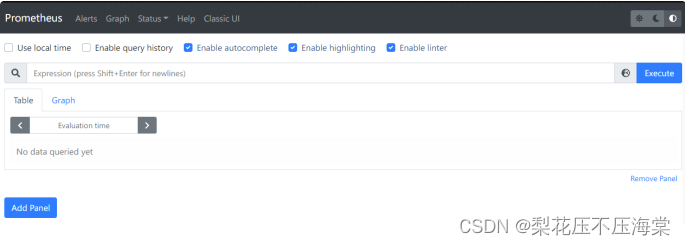 如果浏览器弹出下图警告,多半是服务器时间与浏览器时间不匹配,解决办法:刷新服务器时间后重试
 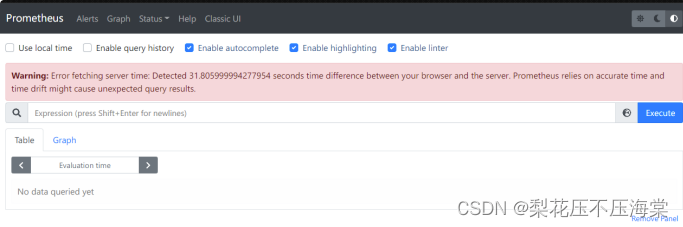 更新服务器时间最直接的办法:
 4、上传 node_exporter-1.2.2.linux-amd64.tar.gz 到/opt⽬录
 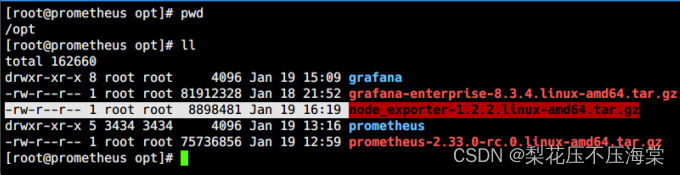 5.解压安装包
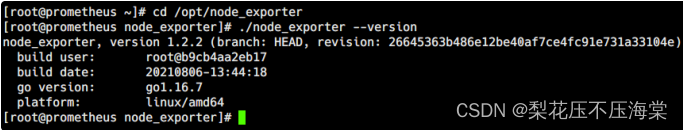 6查验参数列表 使⽤ ./node_exporter --help 查看参数列表,可知Node exporter的运⾏端⼝默认是9100
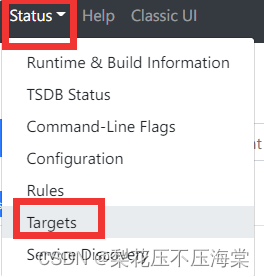
 1.4、部署可视化数据监控⼤盘 1、监控Linux主机数据
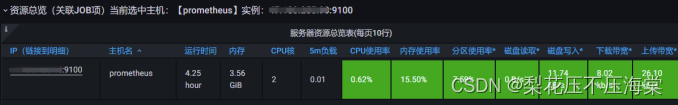 调整数据采集频率,点击右侧的数据刷新频率按钮,选择15s⼤盘刷新⼀次
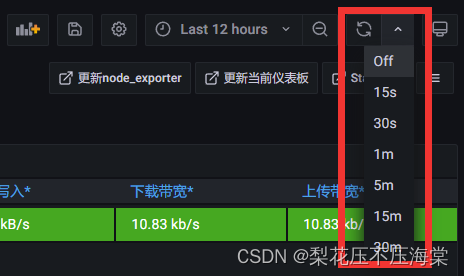
 4Application启动类中加入bean
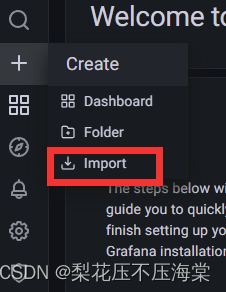 7、输⼊JVM监控⼤盘ID:12856,选择Prometheus数据源并提交保存
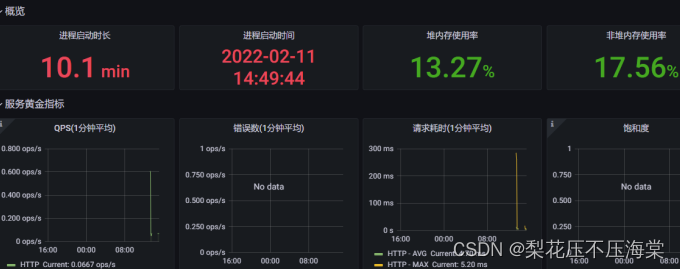
 2、解压安装
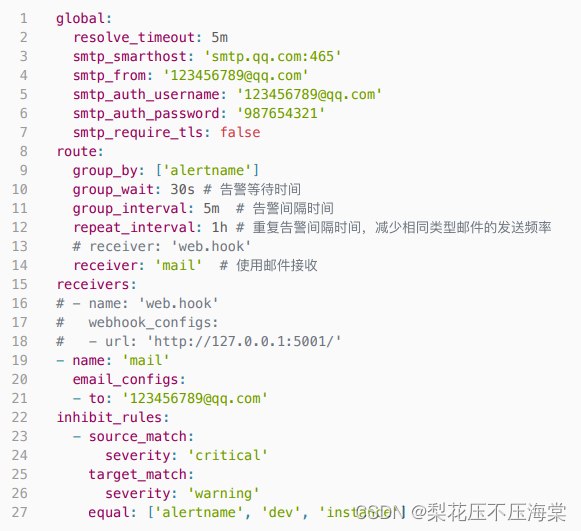
 4.修改 alertmanager.yml 增加配置邮箱
 5、安装邮件服务
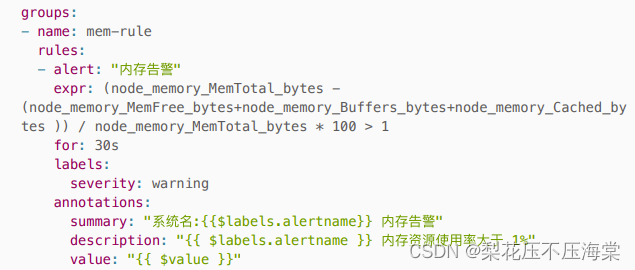 3、修改prometheus.yml 保存后重启prometheus
 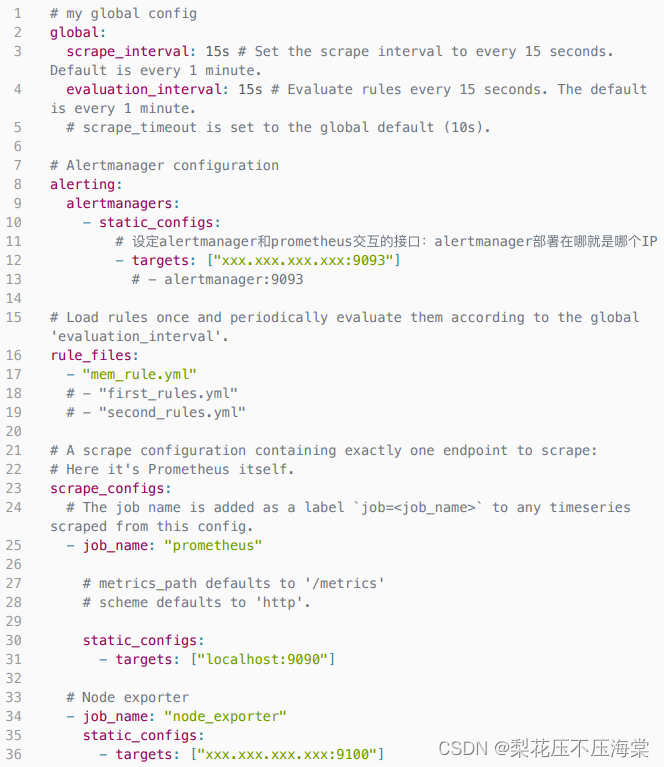 ⽬录下的⽂件内容:
 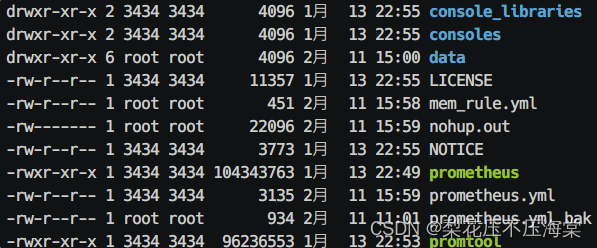 9、浏览器输⼊alerts地址,验证启动结果
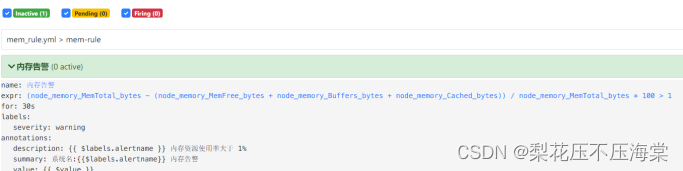
 持续⼀段时间后可收到监控告警邮件
【本文地址】